
EagleMCP connects MCP-compatible assistants to the Obstack Stack. Included in every plan, without a connector or per-tool-call charge. Model-provider charges are separate.
Explore EagleMCPObstack Stack
A complete observability stack, running on your servers.
The components, chosen to fit together, configured by us around Bee and supported as one product. EagleMCP is included; EagleSRE is in preview. Open standards at every seam, so no part of it locks you in.
01 / What's inside
Every component has one job.
Bee, Eagle, EagleSRE and EagleMCP are our products. The rest are open-source projects we deploy, wire together and support, so you get one supported deployment.
CollectObstack
Bee
Application agentDistributed tracing and profiling inside a microservice and on the host: HTTP, gRPC, TLS, MySQL, Redis and named Node.js awaits, no coordinator.
How it worksCollect
Grafana Beyla
Broad eBPF coverageCovers the runtimes and protocols Bee does not reach yet, such as PostgreSQL and MongoDB, with the same zero-code model.
Ship
Vector
Node-local collectorReceives OTLP from the agents, collects host metrics and logs, and routes every signal onward.
Store
GreptimeDB
Telemetry databaseMetrics, logs and traces in one database, queried with SQL and PromQL. Data at rest lives in S3-compatible object storage, so the database and the files are one store you can see.
See
Grafana
DashboardsExploration and dashboards on the tool your team already knows, with reference dashboards for Bee. The Grafana MCP server sits next to it for agents.
How it worksSee
Grafana MCP server
Access for agentsA separate MCP server that ships with Grafana. Assistants you allow query dashboards and datasources through Grafana RBAC.
How it worksAct
Prometheus Alertmanager
Alert routingGroups, inhibits, silences and routes firing alerts from Prometheus and Grafana onto receivers. The Prometheus-native half of paging.
ActObstackOptional
EagleSRE
On-call, incidents and investigationSchedules, escalations, ChatOps and an investigation agent alongside Eagle. In preview; contact us for availability and pricing.
How it worksConnectObstack
EagleMCP
Access for assistantsConnect MCP-compatible assistants to the Obstack Stack. Included in every tier, without a connector fee or per-tool-call charge.
How it worksSeeObstack
Eagle
Observability consoleWorkloads, logs, traces and Ask Eagle alongside Grafana, reading the same store.
How it works02 / Setup and migration
We build it for you. Anything custom is quoted first.
Setup is part of the full Obstack Stack, self-hosted or on Obstack Cloud: you get a working observability platform, not a box of parts. Tailoring it to your team is billed on time and materials.
Infrastructure, configured
We deploy and configure every component for your environment: agents on your nodes, Vector pipelines, GreptimeDB with retention on S3-compatible object storage, Grafana and Prometheus Alertmanager. Eagle and EagleMCP are included; EagleSRE is in preview.
Reference dashboards
Grafana arrives connected to your data, with reference dashboards for hosts and Bee, so the first login shows your fleet, not an empty canvas.
Custom work, quoted first
Dashboards built for your services, alert rules and routing, migration of your current dashboards, alerts, workflows and incidents: billed on time and materials, from a written quote you approve before we start.
Storage in your datacenter
Telemetry lands in Obstack object storage in the EU or US datacenter you pick. 10 TB comes with the plan; more is $179€149 per 10 TB per month.
03 / Data flow
From the kernel to the person on call.
Swipe the diagram sideways to follow the whole path.
04 / Grafana
Dashboards and traces in the Grafana your team already knows.
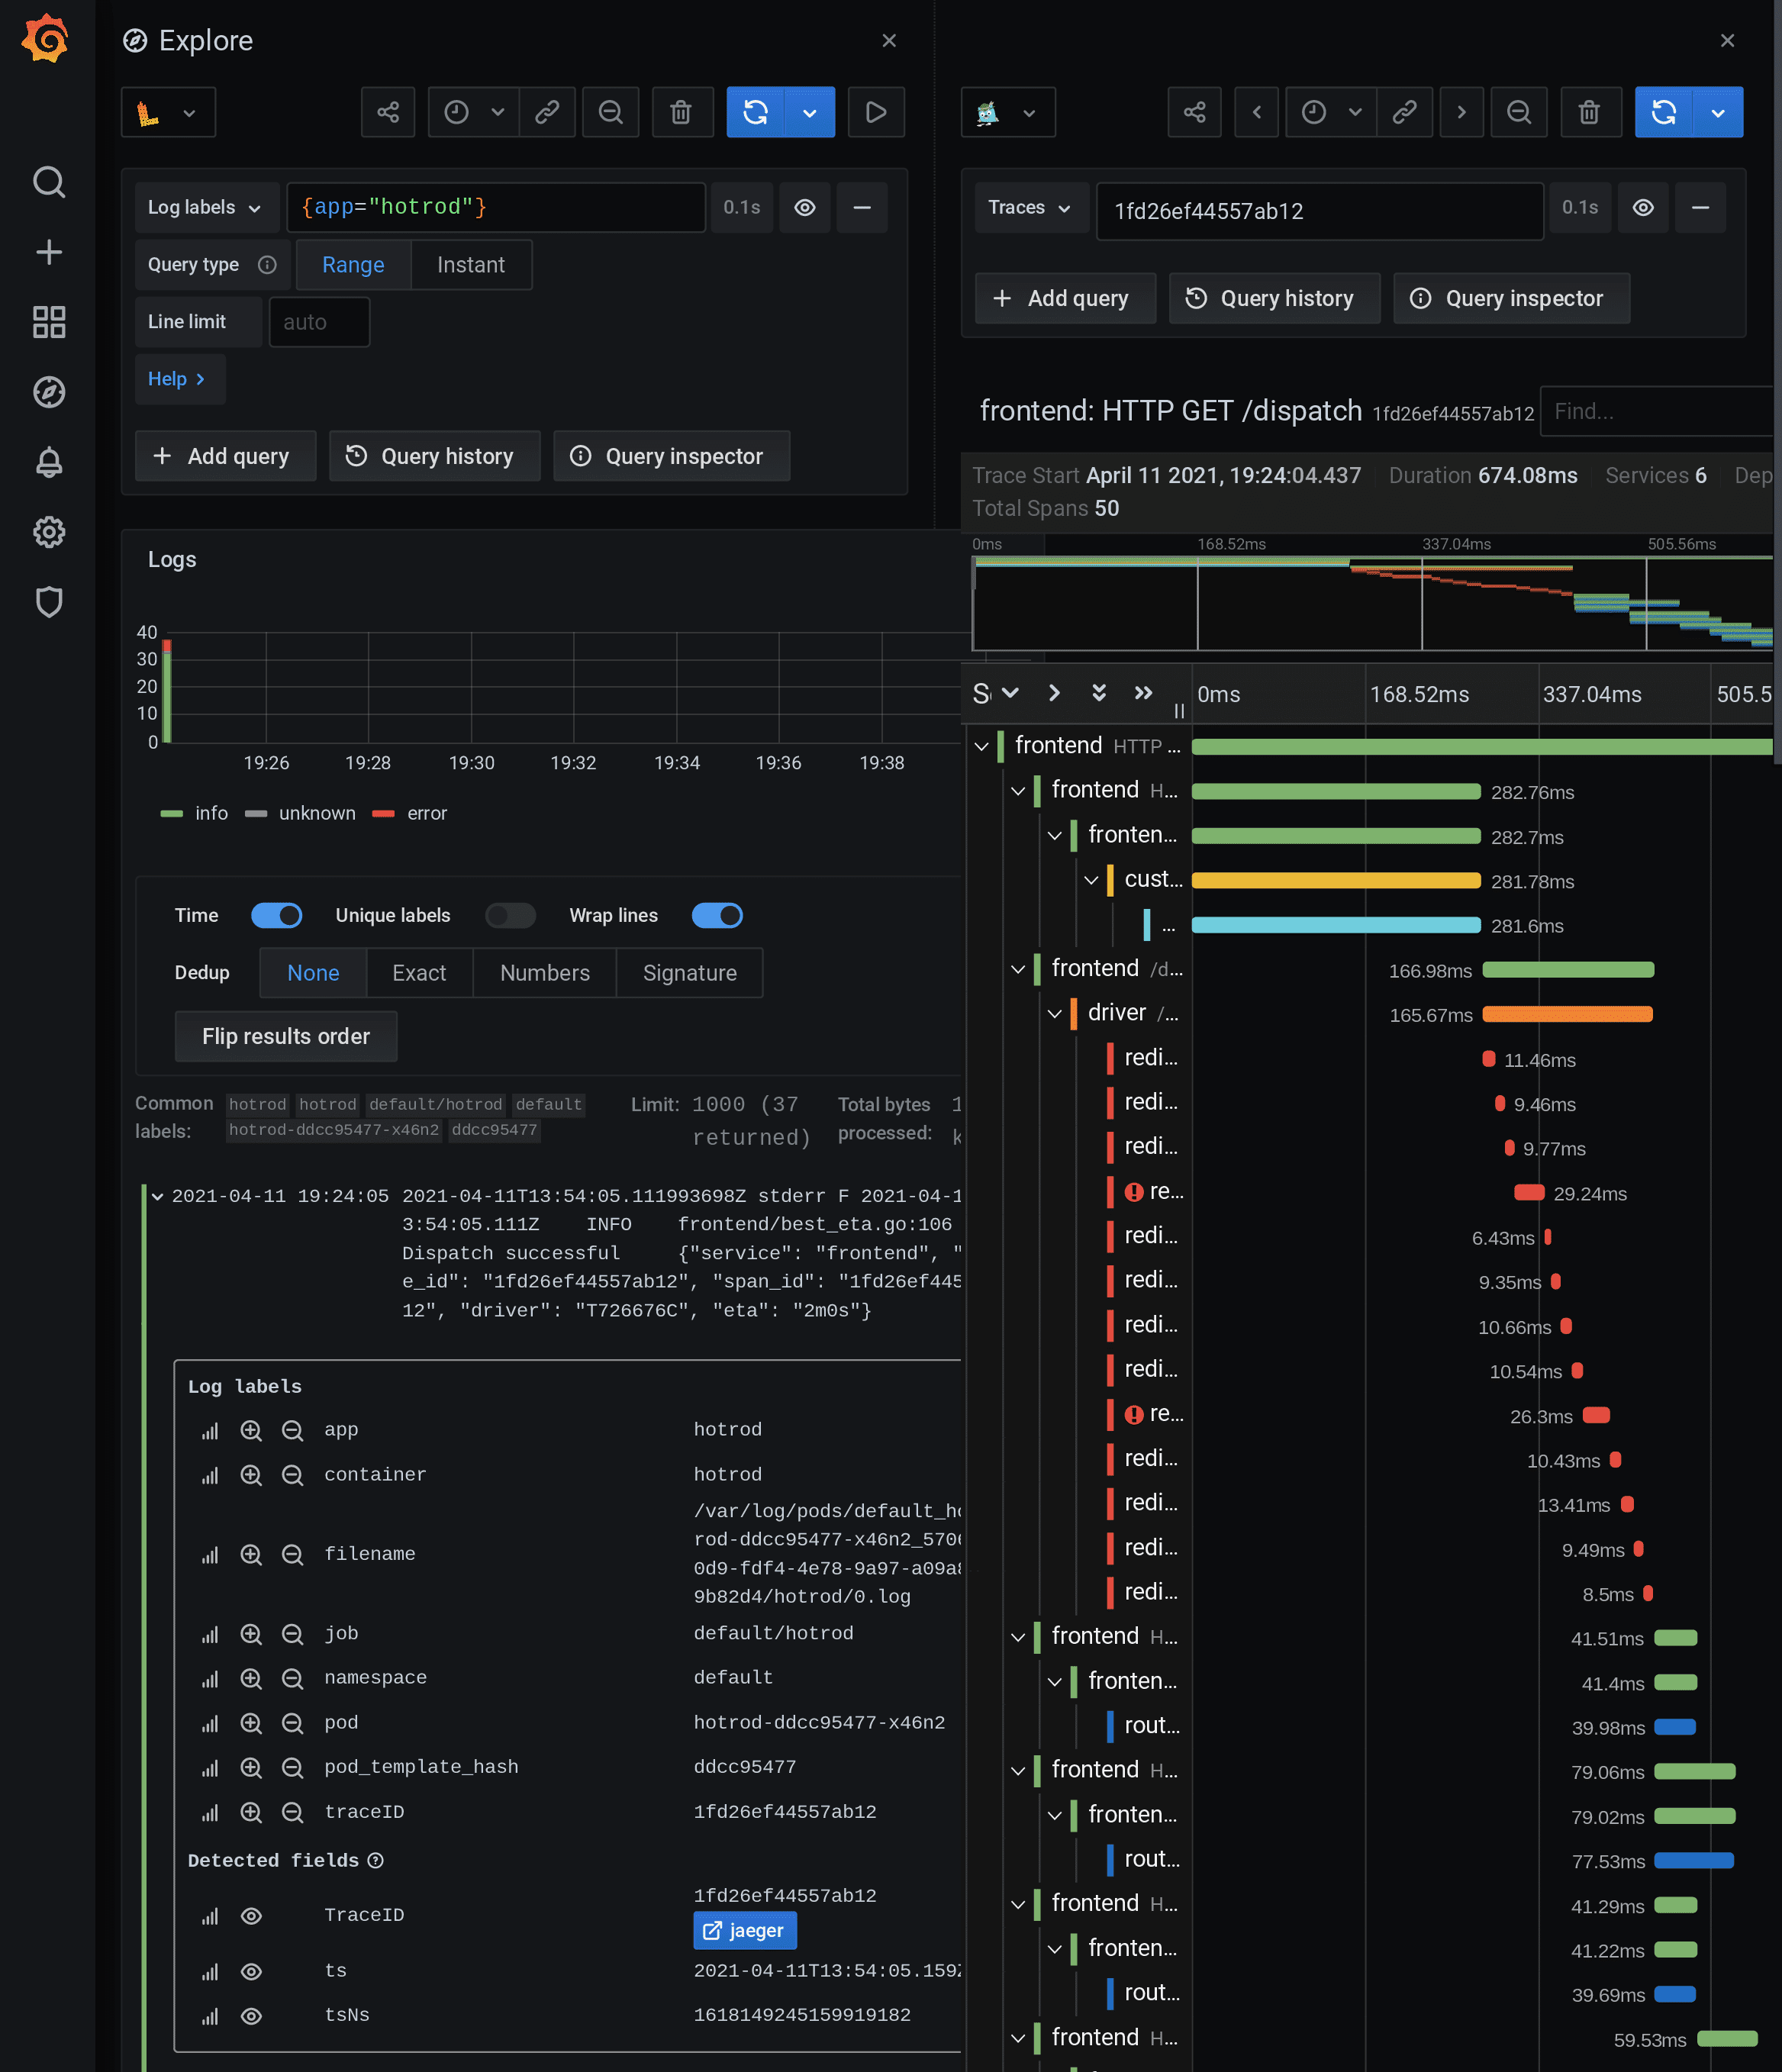
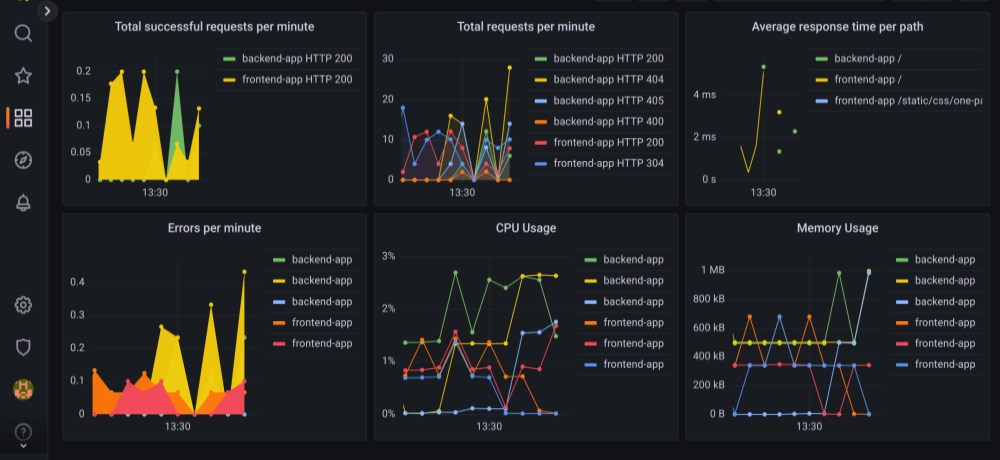
How Grafana and its MCP workGrafana is the exploration layer in the stack, with the Grafana MCP server for agents. Your deployment arrives with reference dashboards for hosts and Bee, wired to your data. The shots below are Grafana itself: a distributed trace next to its logs, and a RED-metrics dashboard of request rate, errors, latency and host resources.
Why the plans cost what they cost
Not one of them counts your nodes. What separates them is the backend: Go is one node with 4 cores, 32 GB RAM and 500 GB NVMe, Pro is one node with 16 cores, 64 GB RAM and 8 TB NVMe, and Max is a three-node HA cluster of the same machines. On top of that sits the support tier and Eagle for exploring your telemetry. Run any of them on hardware you already own and the hosting comes off the price — $1,439€1,199 a month for Pro, for instance.
Professional Services are quoted in advance
Creating custom dashboards, wiring components, designing alert rules, migrating existing dashboards and building bespoke projects are billed on time and materials. Every request is estimated in a written quote you approve before any work starts; then we invoice the time actually spent. Nothing is charged without your prior agreement.
Prices follow the EUR/USD switch in the header. USD is 20% above the euro list; the invoice is issued in the currency you pick.
05 / Bee and Beyla together
Deep where it matters, broad everywhere else.
Bee traces and profiles inside a microservice and across processes on the host, then continues the same distributed trace across machines. Named Node.js awaits, full MySQL queries, evidence-only links, no coordinator.
Beyla covers the long tail with broader protocol and runtime support. Both speak OTLP to the same Vector, so every trace lands in the same place and your dashboards don't care which agent saw it.
Read how Bee works06 / Alertmanager and EagleSRE
Alert routing, then the people on call.
Prometheus Alertmanager groups, inhibits, silences and routes firing alerts from Prometheus and Grafana. It is the receiver layer operators already know.
EagleSRE brings schedules, escalations, incidents and an investigation agent alongside Eagle. Respond in the console, Slack or Microsoft Teams. It is in preview; contact us for availability and pricing.
Explore EagleSREOur own console, built for the Obstack data model, with Ask Eagle and Serverless functions. It sits in the stack as an option next to Grafana, not a forced replacement.
See what Eagle doesOn your servers, or run by us. Flat pricing either way.
From $59€49 a month on shared cloud capacity to $5,399€4,499 for a three-node HA cluster with Tier 3 support around the clock. No per-node licence, whichever you pick. The agreed components, set up by us, one support contract — and 30 days free on your own cluster before you decide.