
Grafana is the screen. Not the database, not the pager.
It is a web app for graphs, logs and traces. Obstack stores the telemetry; Grafana is the window onto it. You open a dashboard the way you open a live status board — request rate, errors, latency — and you can ask a one-off question without saving anything.
Four jobs. That is the whole product, for a new user.
If you have never used it: Grafana does not collect data and it does not wake people up. It shows you what is already stored, and it can raise a hand when a number looks wrong.
A page of live graphs you keep. Error rate, latency, CPU, a trace next to its logs. You open it the way you open a status board, not a query editor.
A scratch pad. Ask “what did this service do in the last hour?”, look, and leave. Nothing has to be saved. Useful when you do not yet know which dashboard to build.
A line on a graph that should not be crossed. Grafana watches it. When it is crossed, an alert fires — into Alertmanager in this stack, then to people if you add EagleSRE.
Who can see which dashboards. Grafana is a shared wall, not a personal notebook, so teams put service boards in folders and give people logins.
The rest of the stack does the other jobs.
People often say "Grafana" when they mean the whole observability system. In Obstack the name is narrower, on purpose.
Not the database
Grafana does not store your telemetry. In Obstack that is GreptimeDB. Grafana only reads it, the way a spreadsheet reads a file.
Not the agent
It does not sit on your servers collecting packets. Bee and Beyla do that, and send OTLP into the stack.
Not on-call
It will not page a human or know who is on the rota. That is Alertmanager for routing and EagleSRE, optional, for people.
Not Grafana Cloud
The Grafana in Obstack is the open-source app we run for you, on your servers or in the region you pick. There is no Grafana Cloud host-hour or GB-written bill.
A dashboard is a page of graphs. Explore is the scratch pad next to it.
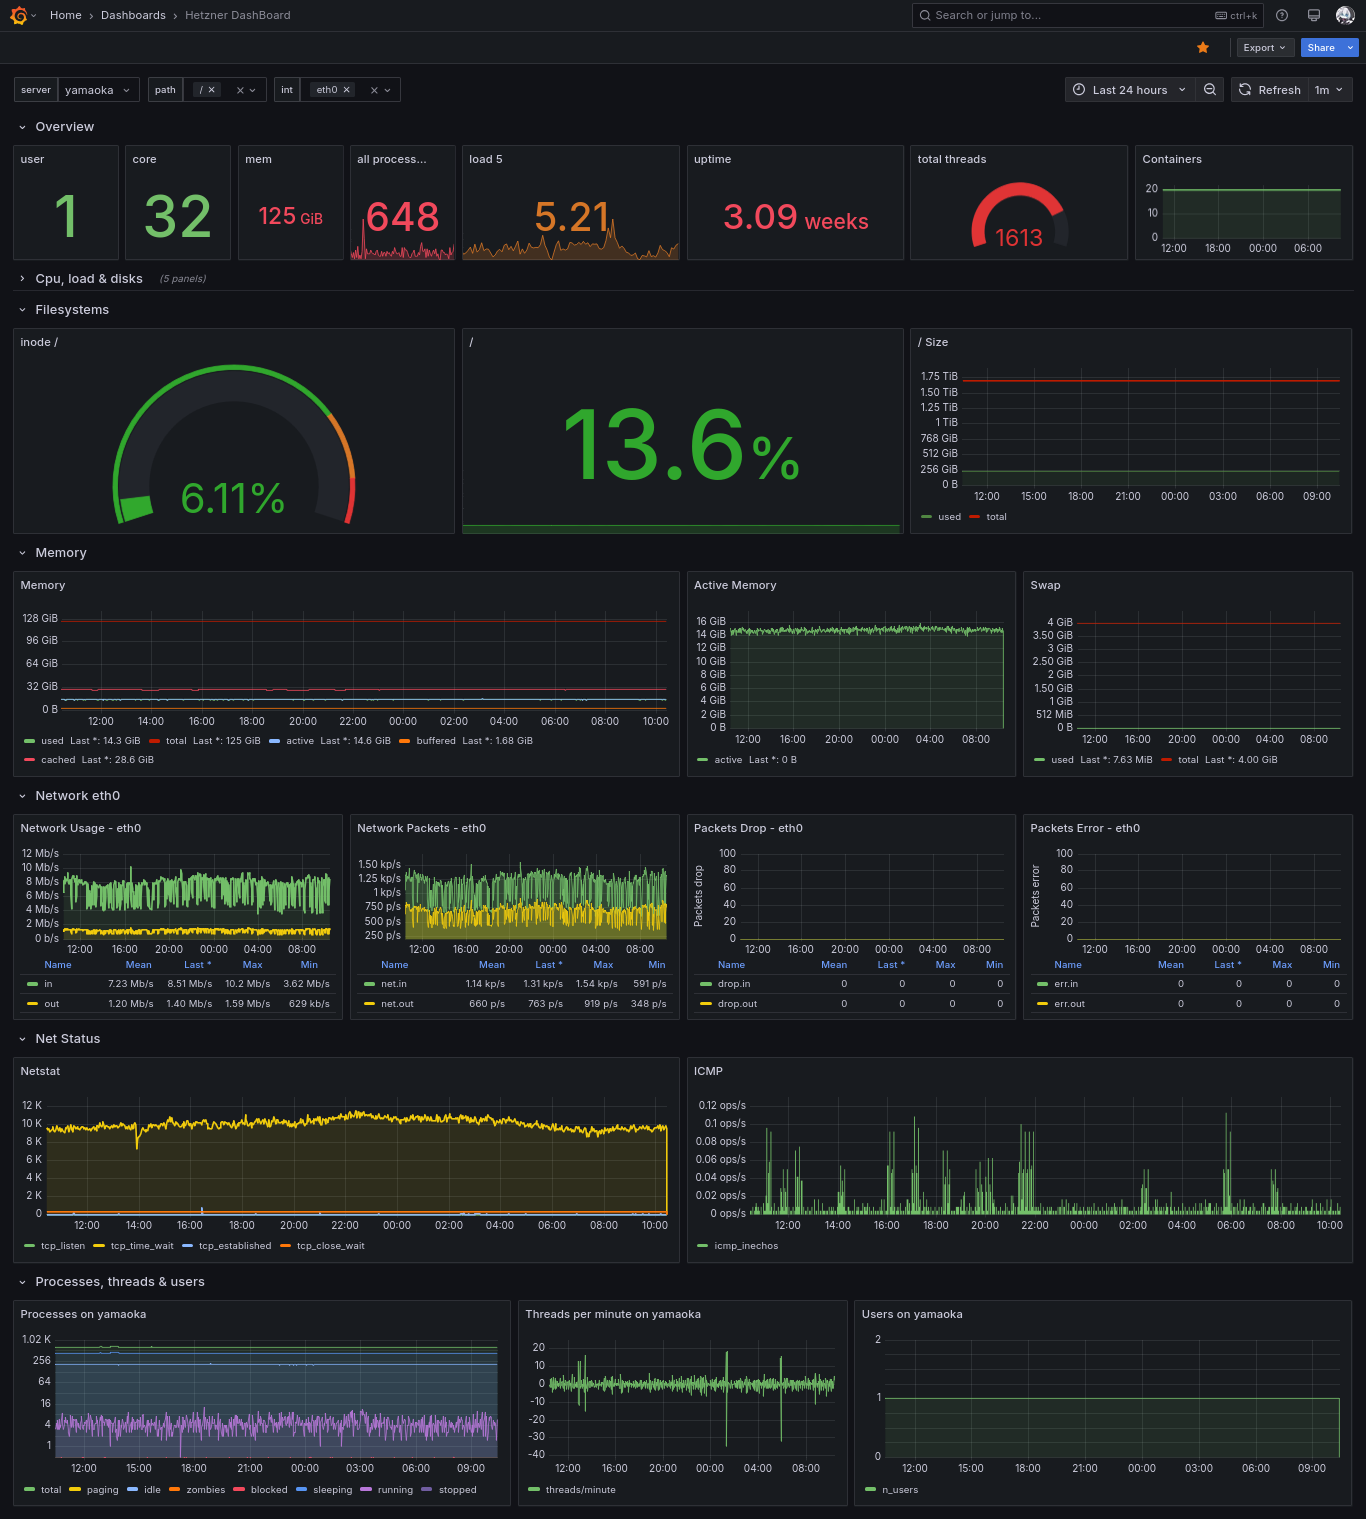
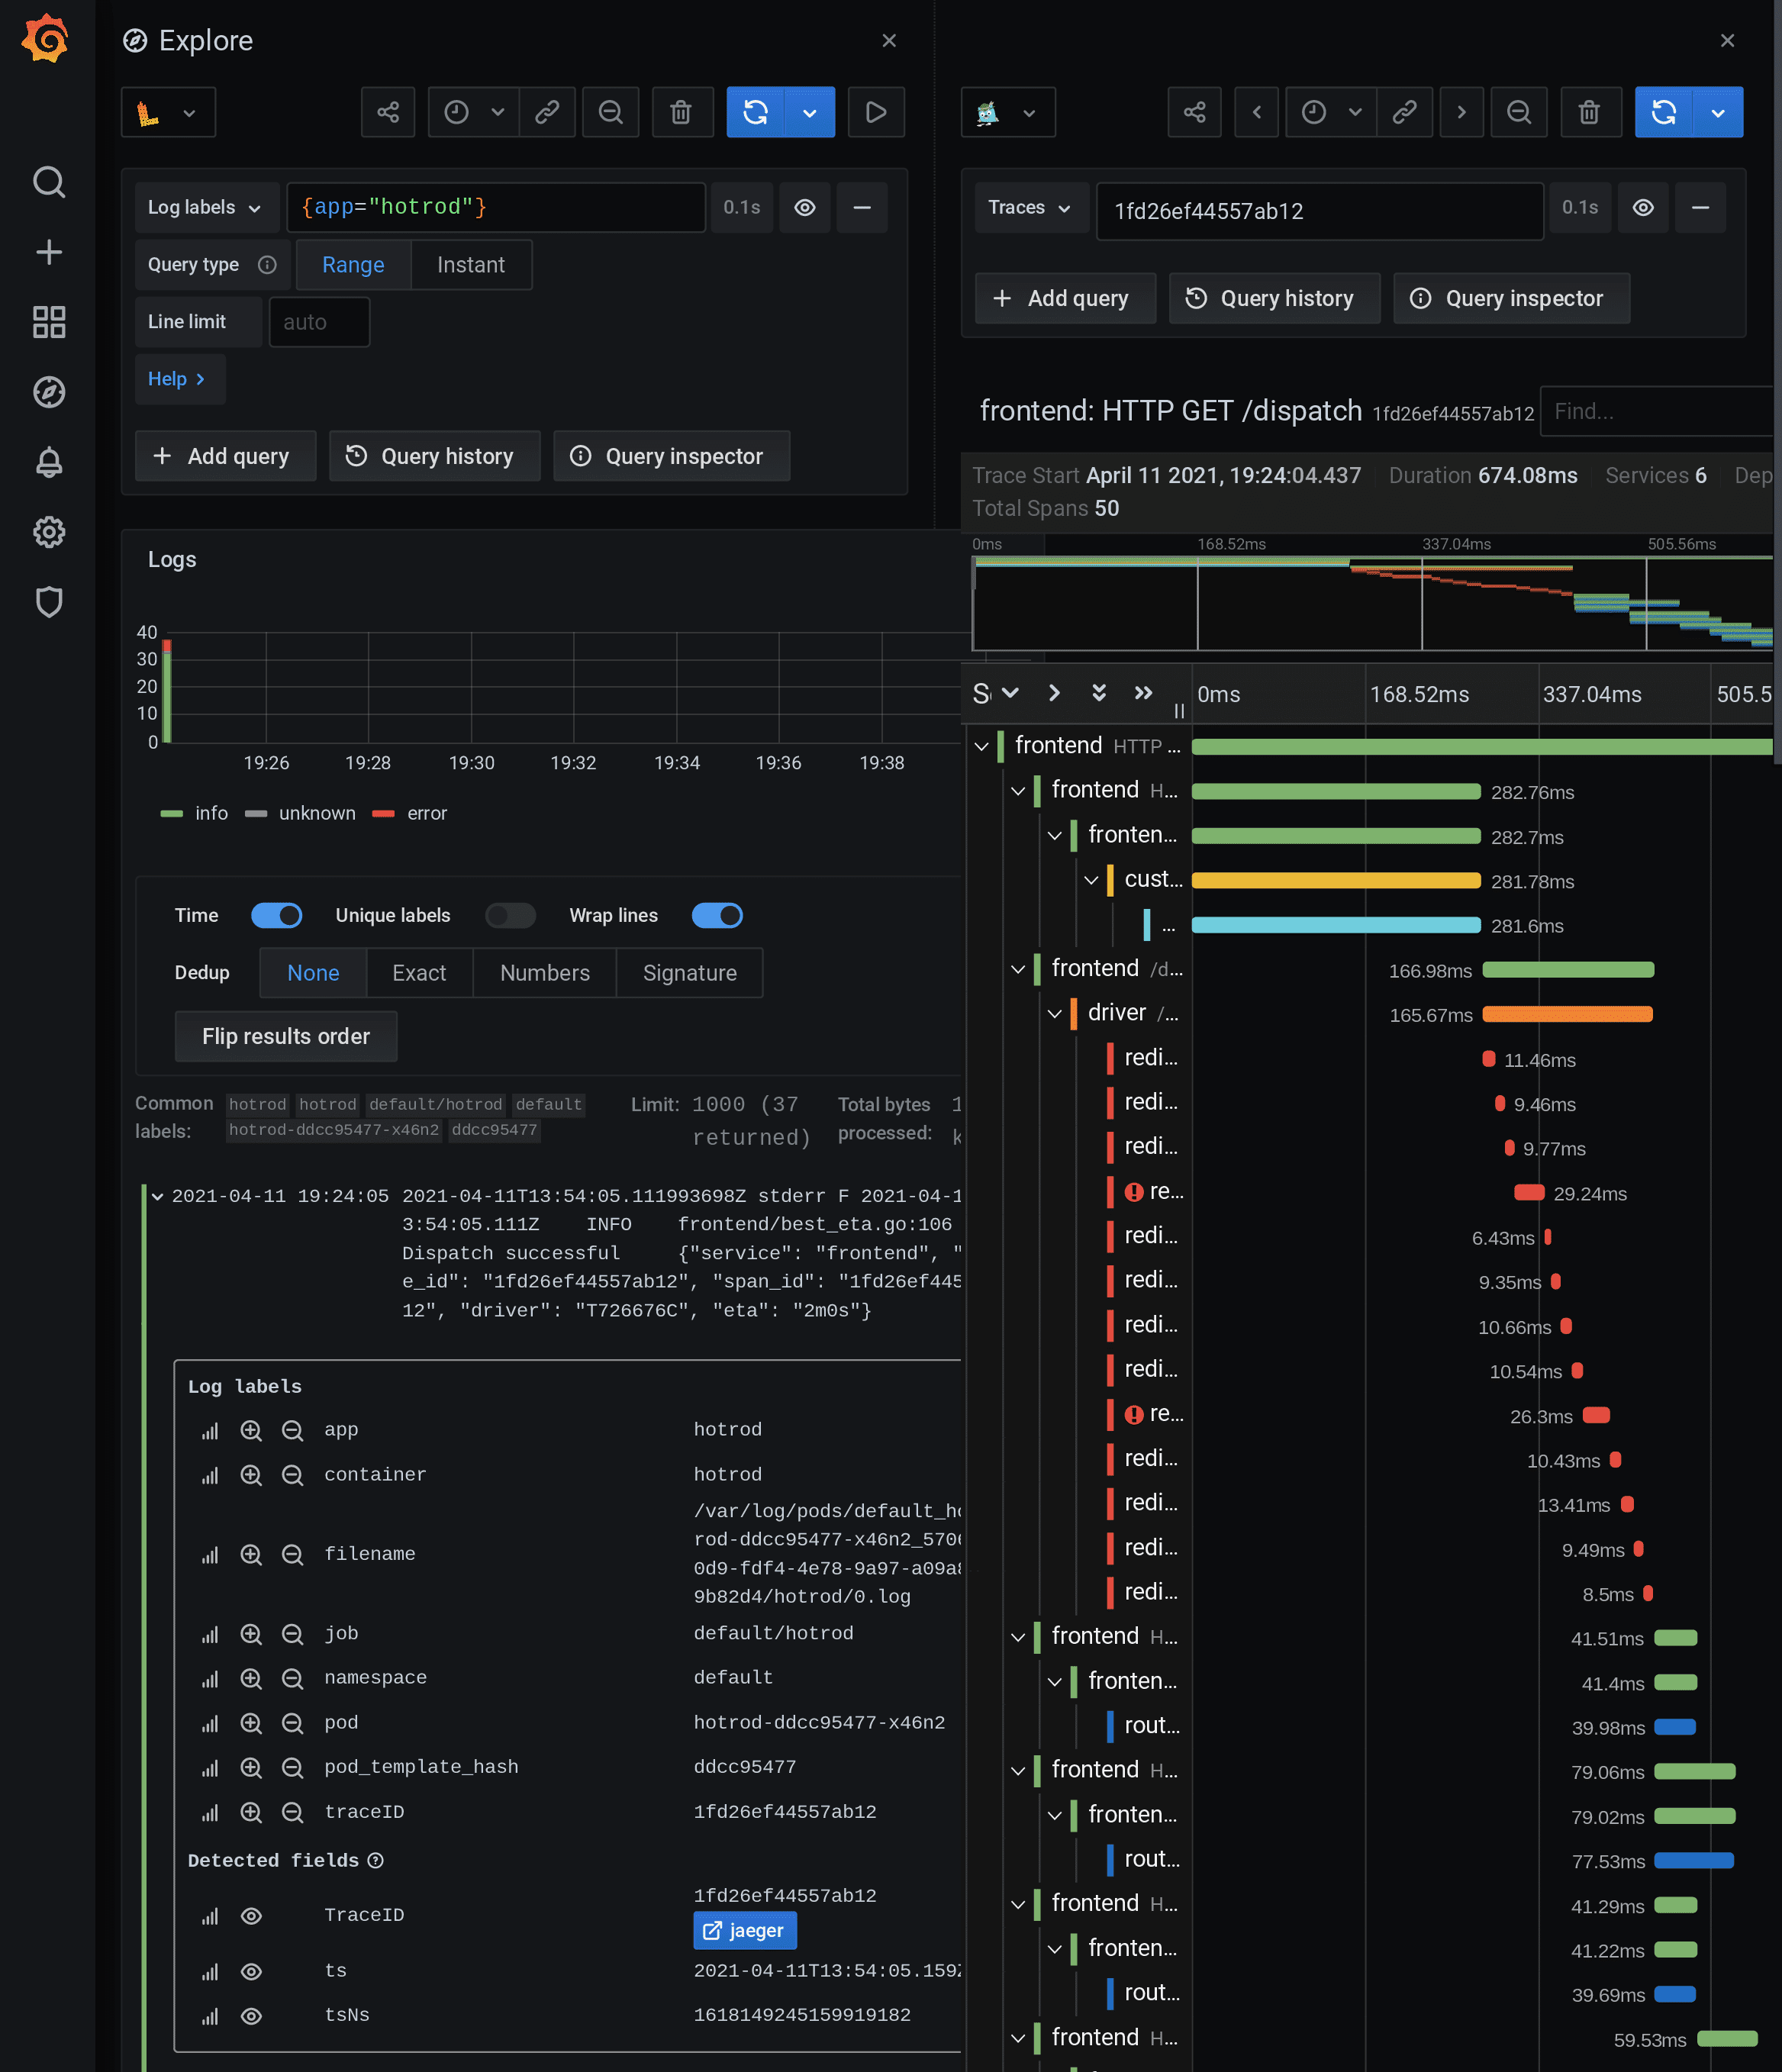
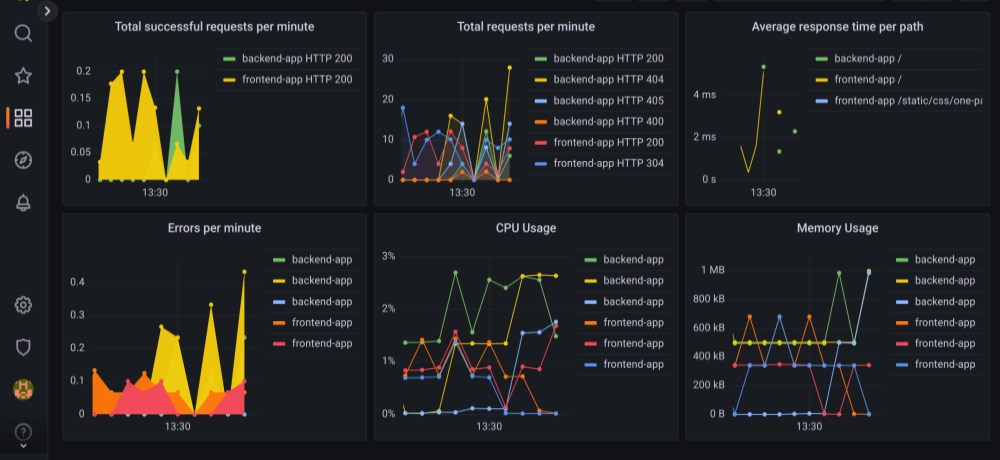
The shots below are Grafana itself: a distributed trace next to the logs for the same request, and a dashboard of request rate, errors, latency and host resources. That is the job — look, then decide.
You log in. The boards already have your data.
We install Grafana, point it at GreptimeDB, and ship reference dashboards for hosts and Bee. The first login is not an empty org. Custom boards and alert design are Professional Services, quoted in advance.
Metrics, logs and traces in one place
Numbers (metrics), lines of text (logs) and a request's path through services (a trace) all live in GreptimeDB. Grafana can put them on the same dashboard, so you do not jump between three tools to ask "why was checkout slow?"
Alerting stops at a hand-raise
A Grafana alert rule says “this graph went bad.” Prometheus Alertmanager decides how that notice is grouped and routed. EagleSRE, if you add it, pages the person on call. Grafana does not have to know the rota.
Assistants can look at the same screen you do.
MCP is a way for an AI assistant to call tools. The Grafana MCP server is Grafana Labs' open-source one: the assistant can search dashboards, run a panel, query a datasource and hand you a link to the same view. It logs in as a Grafana user with permissions, on your network. You do not need it to use Grafana yourself.
Find a dashboard
Search by name or folder, get a short summary, read which panels it has, and run one of those panels for a time range — without you clicking around.
Ask the data
Query the same datasources Grafana uses. In Obstack that is mostly GreptimeDB, in the language Prometheus users already write (PromQL). Grafana can also talk to logs and other stores it already knows.
Hand you the link
When the assistant has an answer, it can give you a URL to that dashboard, panel or Explore view, so you land on the same screen it just read.
Same permissions as a person
It logs in as a Grafana service account. It only sees what that account is allowed to see. Nothing phones home to Grafana Cloud unless you pointed Grafana there.
Grafana, EagleSRE and EagleMCP.
EagleSRE brings incidents, on-call and investigations alongside Eagle. EagleMCP connects assistants to the stack. EagleMCP is included in every stack plan; EagleSRE is in preview. Grafana MCP remains included with Grafana.
Grafana MCP
Read graphs, logs, traces and alert rules — what is on the screen. Included with Grafana in the stack.
EagleMCP
MCP access for assistants working with the Obstack Stack. Included in every stack plan; model-provider fees are separate.
Grafana MCP capabilities from Grafana Labs public documentation, reviewed September 2026. Grafana is a trademark of Grafana Labs. Obstack deploys the open-source server next to your Grafana.
Not a Grafana Cloud subscription. Included with Stack and Cloud.
Grafana and its MCP server ship with Obstack Stack and Obstack Cloud. Unlimited users, dashboards and alert rules. Eagle, our own console, sits next to Grafana as an option, not a forced replacement.
Buy the stack. Grafana comes with it.
Grafana comes with every plan, with unlimited users, dashboards and alert rules and no seat fee. Flat from $59€49 a month, on your own hardware or on Obstack Cloud in the region you choose. Custom dashboards and alert design are Professional Services, quoted in advance.
Ask about Grafana